Texture Analysis SolutionsBread Softness - White and Whole-wheat
Highlights
- Objective texture comparison of varieties of bread to understand and optimize formulation
- Repeatable and accurate comparison test method using a software-controlled texture analyzer
- Industry-standard compression fixture to replicate the squeeze and release of a slice of bread
- Quantified hardness texture correlated to consumer-acceptable softness levels
Situation
Wholewheat bread is frequently regarded by consumers as a healthier choice than white bread made from more refined flour. However, the texture of white bread is often regarded as preferable. Can whole-wheat bread be produced with the same degree of firmness as white bread, and can this be objectively measured?
We demonstrated to our client the benefits of accurate testing. As many variables as possible were controlled for by selecting samples made by the same company on the same day. Whole-wheat bread is nevertheless inherently more variable than white bread, due to inclusion of all parts of the grain.flour. However, the texture of white bread is often regarded as preferable. Can whole-wheat bread be produced with the same degree of firmness as white bread, and can this be objectively measured?
Method
A software-controlled Texture Analyzer was used, fitted with a 25 N intelligent loadcell and a 36 mm AACC cylinder probe. Samples were left packaged until being tested, to avoid air-drying.
Three compressions were performed, in rapid succession, on different parts of each slice.
For each compression, the test program moved the probe until it touched the surface of the sample.
It then moved the probe 5 mm into the bread at a speed of 100 mm/min, before returning at the same speed to the starting position. This allowed sufficient compression, but safely within the thickness of the sample. The TL-Pro software then automatically calculated both the firmness of the product and the work done (energy) to compress each sample.
Results
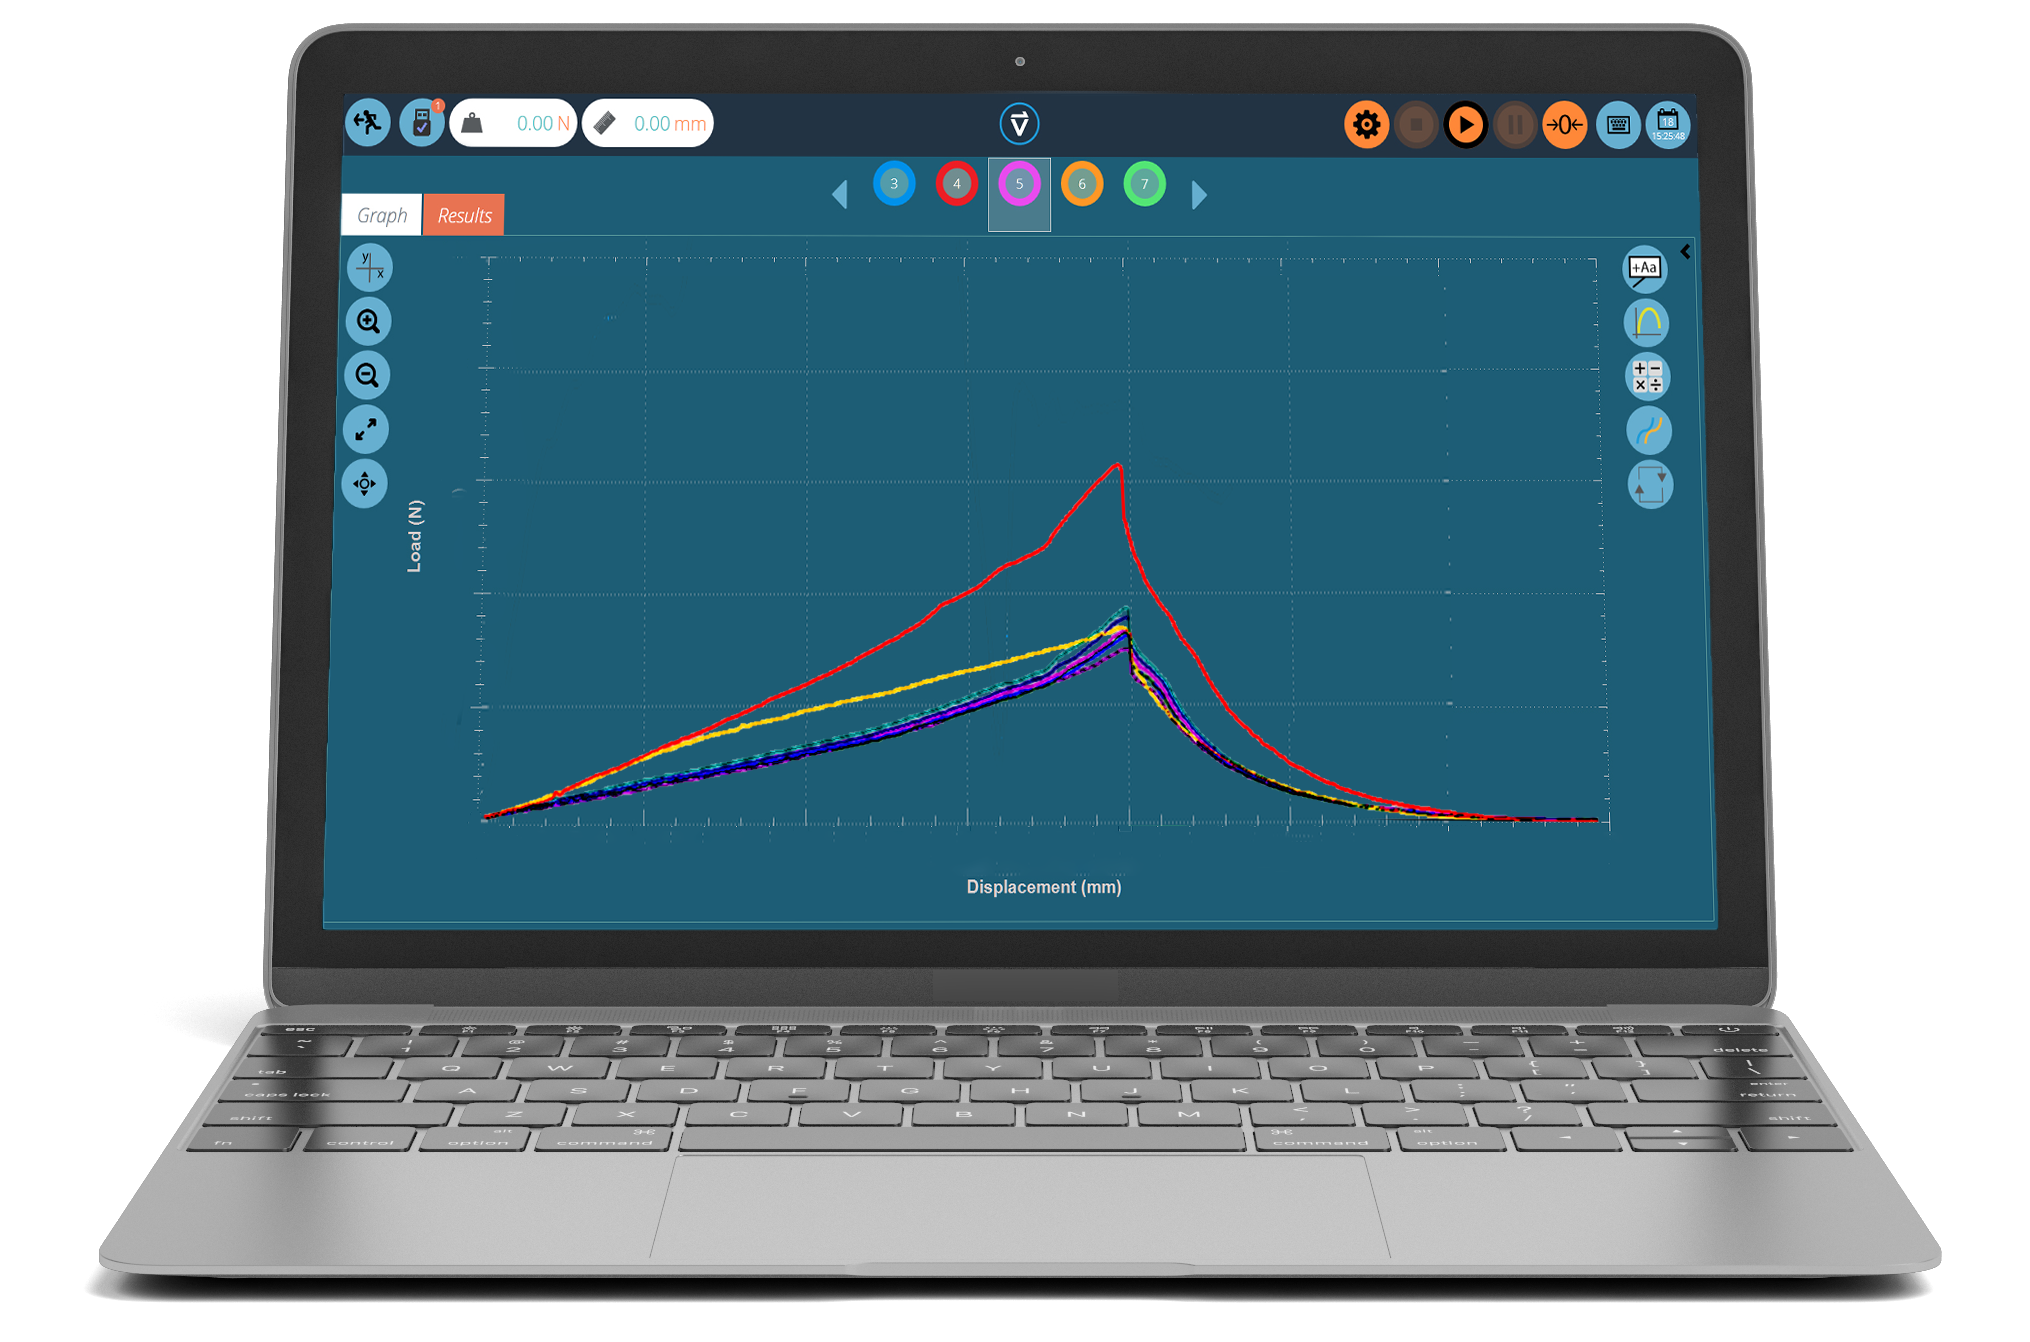
The graphical representation from the texture analysis software, of the test results for the eight samples, is shown here (force applied, against cumulative displacement).
Significance
Consumer textural experience of bread is more than just firmness, and includes dryness and mouthfeel, but this test method does provide accurate and repeatable measurement of firmness. Here it was useful to compare different products, but equally it can be applied to quality assure product consistency, and to measure changes in product during shelf life.
As expected, this demonstration also revealed a greater variability within samples of the whole-wheat product than were found in the white bread product with its more uniform refined flour. The CV statistic is the best indicator of this: the higher the number, the more variation exists among the samples.
Texture analysis software calculates mouthfeel parameters from curves of physical measurements
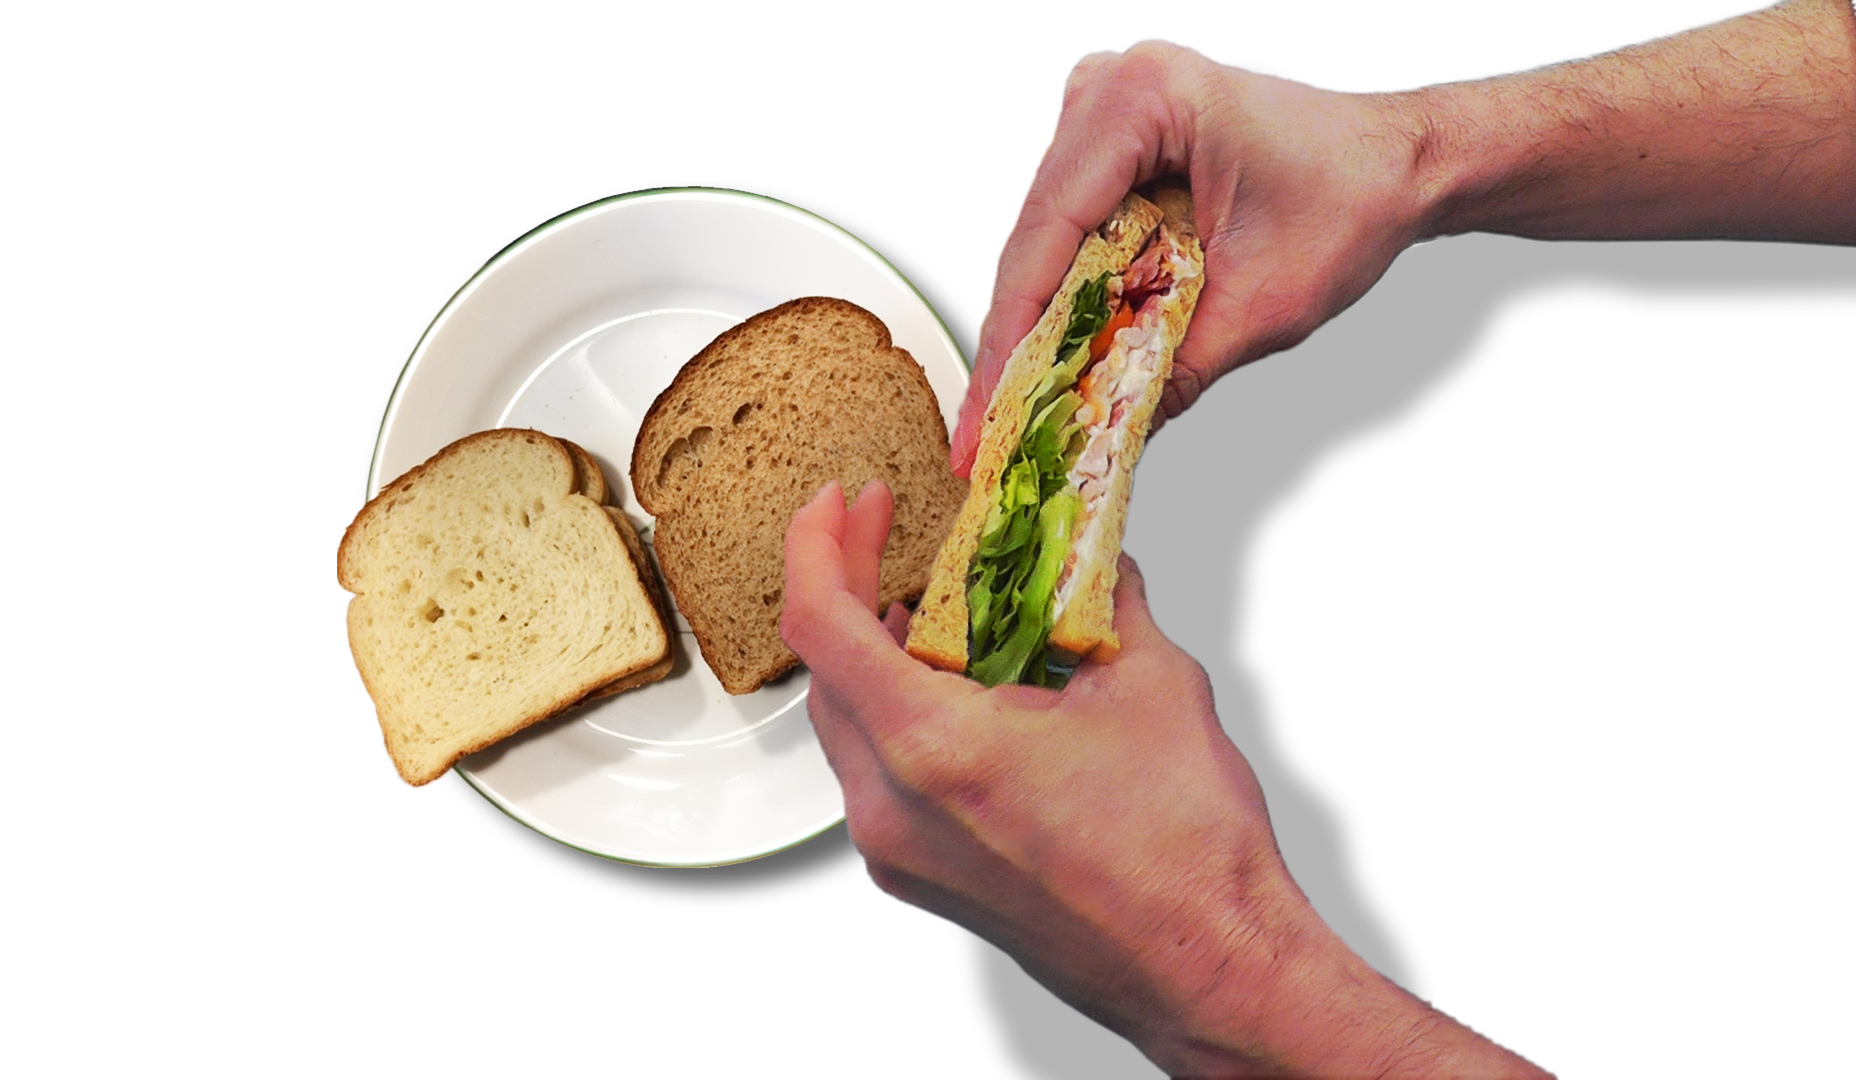
Squeezing the bread gives sensory feedback of softness which correlates to desired experience


